
Let´s suppose your patient is in a shock. The question is whether to administer fluid or not, i.e. is the patient fluid responsive and will the administration of fluid result in an increase of the STROKE VOLUME?
Assessment of so-called dynamic preload parameters may answer this question. E.g. hemodynamic reaction to raise of lower limbs (= PLRT, passive leg raise test) may be used. Following cases show change of stroke volume (measured in LVOT by VTI, a parameter which determines stroke volume) resulting from the lower limbs elevation.
Percentual change of the VTI (in LVOT) reflects the percentual change of left ventricular stroke volume. It can be calculated according to the equation:
percentual change % = (VTI during PLRT – VTI before PLRT)/(VTI before PLRT).
The cut-off value lies between 10 and 15 %. Results above this value predict positive fluid responsiveness, i.e. administration of a bolus of fluid will very probably result in a significant increase in stroke volume. Thus, the eventual risk resulting from administration of fluid will be low on contrary to expected benefit, which will be high (the patient´s actual hemodynamics is on the ascending part of the Frank-Starling curve).
However, everything is quite relative – cut-off values, the correct technique of passive leg raise test, the volume of fluid bolus …
Take-home message – significant pathologies are easy to detect, i.e. it is essential to diagnose and cure them. Insignificant and small pathologies are more susceptible to measurement errors, and their correction may not result in a significant positive clinical outcome.
So, let´s stay calm and correct substantial pathologies. There is no time for nuances anyway …
1st case:

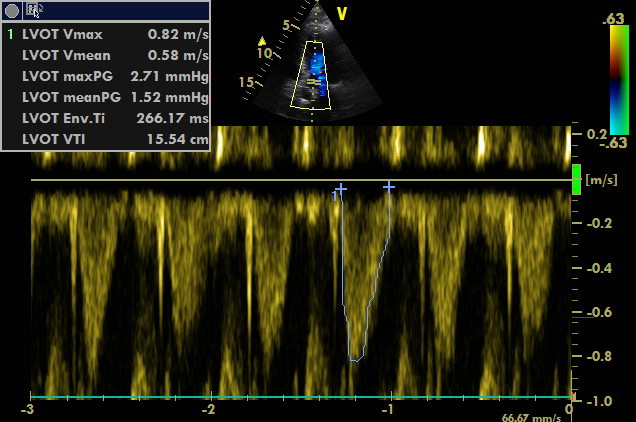
A5C, PW sample volume placed into LVOT
Measurement of VTI before passive leg raise test – 14.03 cm as a sign of low stroke volume.
A5C, PW sample volume placed into LVOT
Measurement of VTI during passive leg raise test – 15.54 cm as a sign of low stroke volume.
VTI increased by 1.51 cm. Percentual change: 1.51/14.03 = 10.8 % which corresponds to borderline finding.
Let´s look at other values which may help during the assessment of fluid responsiveness:

A4C, PW sample volume above leaflets of the mitral valve in the left ventricle
Mitral inflow
E-wave with a long deceleration time. A-wave is not present; however, it is marked because the machine requires it. Thus, the E/A ratio is not valid.

A4C, TDI sample volume placed at the lateral part of the mitral valve annulus
“Perfect” E´-wave. Ventricle presents with good diastolic relaxation. E/E´ ratio = 7.52 (= below 8).
Both are signs of a low left ventricular filling pressure.

Subcostal scanning plane, inferior vena cava visualised at its longitudinal axis, M mode
Variation of relatively narrow inferior vena cava. Variation in not measured but estimated to be approximately 40 %.
Conclusion:
- Borderline increase of VTI (and therefore of stroke volume) during passive leg raise test (10.8 %).
- Low left ventricular filling pressure.
- Significant variation of inferior vena cava diameter during quiet spontaneous ventilation.
Administration of fluid will probably result in a significant increase in stroke volume. However, the probability of such a reaction is not that high. Low left ventricular filling pressure and clearly expressed variation of inferior vena cava during quiet respiration both suggest that the patient will tolerate a small amount of fluid. Even though the finding is borderline, I would not be worried to administer a bolus of 250 ml of crystalloid solution. Then, VTI should be measured once more to assess the effect of administration of fluid. If the patient´s condition does not improve, another series of measurement and assessment of fluid responsiveness should be performed.
A lot of work? DEFINITELY, a lot of work. It´s easier for an attending physician to administer a bolus of fluid with blindfolded eyes …
2nd case – the measurement of flow in LVOT before and during passive leg raise test in a patient suffering from atrial fibrillation:

A5C, PW sample volume placed into LVOT, angle correction is applied.
Average should be calculated out of measured values in case of arrhythmia.

A5C, PW sample volume placed into LVOT, angle correction is applied.
Repeated measurements of VTI due to the presence of atrial fibrillation, i.e. alternating stroke volume. Average should be calculated out of measured values in case of arrhythmia.
Lower limbs should be raised, and the measurement repeated (=PLRT). Increase of VTI during PLRT should be assessed, and thus, fluid responsiveness determined.
The 3rd case shows the use of measurement of stroke volume variation during mechanical ventilation:
Most stroke volume variation measurements are based and validated on parameters providing sufficient changes of intrathoracic pressure, which are transferred to the heart during mechanical ventilation and thus, cause dynamic flow changes. However, these parameters (requirements) are barely present in most critically ill patients. Most important conditions for the relevance of these measurements are the presence of sinus rhythm, tidal volume at least 8 ml/kg and sufficient pressure amplitude (P plateau – PEEP) at the same time, absence of spontaneous ventilation etc.
Cut-off values are usually set to 12 % according to equation:
% variation = (max – min)/(max + min)/2.
Stroke volume is usually measured with the use of flow in LVOT in A5C or A3C:
A5C, PW sample volume placed into LVOT
Let´s use slow sweep speed of spectral curve recording to display more heart cycles in one image. Variation of flow can be analysed easily in this way. Variation of maximum velocity in LVOT instead of a variation of VTI may simplify the situation a little bit. Let´s calculate the variation between maximum and minimum velocity. Variation of 11 % corresponds to the negative prediction of fluid responsiveness.
However, 11 % is quite near to cut-off value (12 %). Just a small inaccuracy in measurement may result in a false negative prediction of fluid responsiveness. Thus, if a patient presents with circulation failure and lung functions are good, the cut-off value may be shifted to a lower value, which results in lower specificity but higher sensitivity to potential positive fluid responsiveness. On the other hand, if a patient instead presents with pulmonary pathology, the cut-off value may be shifted to a higher value.
At the same time, I also use estimation of left ventricular filling pressure out of E/E´ ratio (E is a maximum velocity of E-wave – i.e. mitral inflow – and E´-wave is a velocity of early ventricular relaxation in tissue Doppler (TDI) in one region of mitral valve annulus):

A4C (A5C would be more precise), TDI sample volume placed at the lateral part of the mitral valve annulus
S´-wave is of normal finding; it does not point out to left ventricular systolic dysfunction.
E´-wave is of borderline finding, diastolic dysfunction is possible. However, E/E´ ratio is low; it does not point out to a high left ventricular filling pressure.
Administration of 250 ml of a crystalloid solution may be administered with further assessment of the effect in this case. Variation of flow in LVOT was just borderline, and E´-wave (TDI) was slightly lower (pointing out to a certain degree of diastolic dysfunction and lower tolerance of volume load). Therefore, it is suitable to reduce the amount of fluid administered to 250 ml.
4th case:

A5C, PW sample volume placed into LVOT, angle correction is applied. Long recording (low sweep speed).
Variation of flow in LVOT during respiration is visible. Low sweep speed of recording results in inaccuracies when measuring the area of VTI, however, maximal velocities can still be marked accurately. Variation of maximal velocity roughly corresponds to the variation of VTI. Maximum and minimum velocity is marked. Variation of 16.8 % corresponds to the positive prediction of fluid responsiveness.
Be aware
Determination of fluid responsiveness ≠ just the flow in LVOT! There are situations which may remind of fluid responsiveness such as tamponade (paradoxical pulse is present in case of hypovolemia without tamponade as well) but require completely different therapy. On the other hand, administration of fluid in some of these situations may temporarily improve the patient´s condition until causal treatment is applied. In the case of pulmonary embolism and significant obstruction of the pulmonary circulatory system, the left ventricle will be hypovolemic and fluid responsive, but the whole heart will not. But in this case, the volume challenge will not raise the stroke volume because of the failing ventricle. The weaker ventricle always determines clinical outcome.
Inferior cava is a favourite structure for determination of fluid status in the body. But let´s leave it to another case… Examination of inferior vena cava may seem to be easy, but there are many pitfalls and false conclusions accompanying its examination.